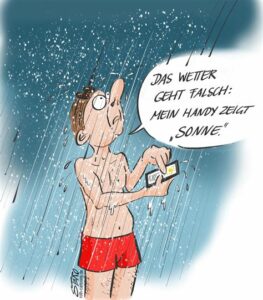
Have you ever been in this situation: You are looking into your weather forecast app: There is a 40% chance that it will rain today. What does it mean? Shall I carry my umbrella with me or not? You decide not to take your umbrella with you – no risk no fun. And then it happens: It rains.
Weather affect us all in our daily life. It’s condition decides, whether to have a BBQ, if a farmer has to water it’s field or if an open-air concert will take place. So, having a proper weather forecast would make the life easier. When why aren’t they so accurate as they should be?
In general one could say: the better the availability of data from satellites or measurement stations and the higher the resolution of the model, the better the forecast. A numerical weather prediction model is based on grid cells. If a phenomenon like a general weather condition (“Großwetterlage”) covers several grid cells, it’s easier to simulate, since the model have enough grid points to calculate with. But the smaller the phenomenon like precipitation, the harder it is to reproduce it, especially if a phenomenon happens to be smaller than a grid cell, it normally gets parametrized. So why not increasing the resolution of the model for that, one could ask. You could do that, if you have enough money and the technology for it: The finer the grid of a model, the more computing time and computing power it takes. In addition, weather forecasts are most accurate for the next couple of days. A forecasts beyond a week is less reliable. Since models can’t collect data from the future, they estimate and assume upcoming weather based on data in the past with similar weather conditions. Still, the atmosphere is a complex system and the further away the event, the harder it is to predict due to too much uncertainty in what happens next.
Precipitation is a special worrier in weather forecast, since its spatial and temporal resolution varies highly. First of all, you have to define, when to count rain as rain: does some droplets count as rain or is rain rain, when it fills up a bucket? If a cloud is supersaturated, precipitation occurs. But on the way down to earth a lot can happen: wind can blow droplets away or droplets collide with obstacles like dust and other particulate matter.
Individual people often misinterpret the probability of precipitation (PoP) in forecasts or are unsure what the percentage stands for. To take up on the above example (40% PoP) and a reference class could enlighten that: If you look at past events with the exact or similar weather condition, in four out of ten days it was raining in that particular place. [1] It tells not, how much time of the day it could rain. This kind of misinterpretation leads to a lack in understanding weather forecasts. So how about using verbal quantifiers instead of probabilistic numbers? A study from Murphy et al. (1980, [2]), where they undertook a survey about the perception of precipitation probability forecasts, states, that verbal qualifiers are more confusing than numerical probabilities. The majority of the participants even preferred forecasts “in which uncertainty is expressed in probabilistic terms”. Another investigation in the subject of people’s interpretation of PoP by Juanchich and Sirota (2016, [3]) underlines the use of probabilities instead as verbal qualifiers as more plausible and recommend, to use reference classes, defined as a class of event that is sampled to produce the probability, to improve the interpretation of PoP.
What I learned out of this confusing with PoP is, when I am planning an outdoor event within the next hours, I will look on special rain tracking apps, which can predict precipitation within the next couple of hours more accurate.
References:
[1] Definition by: DWD Glossar – Nierderschlagswahrscheinlichkeit https://www.dwd.de/DE/service/lexikon/Functions/glossar.html?lv3=101912&lv2=101812, visited on the 3rd of August, 2022
[2] Murphy, A.H., Lichtenstein, S., Fischhoff, B. and Winkler, R.L. (1980). Misinterpretations of Precipitation Probability Forecasts. Bulletin of the American Meteorological Society, 69(7), 695–701. https://doi.org/10.1175/1520-0477(1980)061<0695:MOPPF>2.0.CO;2
[3] Juanchich, M. and Sirota, M. (2016) How to improve people’s interpretation of probabilities of precipitation, Journal of Risk Research, 19:3, 388-404, DOI: 10.1080/13669877.2014.983945


Thanks for this info, Yuting! I had never thought much about what PoP meant, even though I knew it was a probability. But your description explains why weather apps will predict 100% chance of rain and then nothing happens, since the prediction is based on the best data available at the time.
For the question of whether or not to bring an umbrella, I think another aspect that people sometimes pay less attention to is the amount of rain expected. If the PoP is 40% but only a small amount of precipitation is expected, I might risk it. But if there’s 40% chance of severe storms I would pay more attention!
Dear Hannah,
thanks for you comment! And you mentioned a very good point as well. Just because the PoP seems to be high, there is still the possibility that it’s only dripping and not pouring. How heavy the rainfall will be, is still a challenge in weather forecasting (see the above mentioned reasons). For severe storms there are definitely other helping forecasting tools to look at. 🙂
Until now I have always used rain tracking apps, especially when hiking in the mountains, because my mom is a huge fan and always tells me to! She will be so proud that this is actually the better alternative for hiking xD
Thanks Yuting for this Blogpost!
To be honest, I never knew how PoPs are supposed to be interpreted and the verbal quantifier helped me a lot! Its still funny, that different papers disagree on the usage and practicability of PoP. It is eye-catching that one paper is quite old and the other very new though, but I still wonder which methodology the two papers used and how they arrived at their results. Maybe I’ll take a deeper look at them if I have time!
Which one do ypu think is more reliable and used a better approach maybe?
Haha, thanks for the comment, Marina.
Yes! Rain tracking apps are the best ones! Especially for the same day. 😀
It’s true. There are like 35 years between the papers, but it still seems, that the interpretation of PoP still confuses people – back then and today. As far as I remember both paper used surveys regarding PoP the took on the general public. It is hard to tell, which paper is more reliable since the surveys differ in what was asked. But in my opinion, since Juanchich, M. and Sirota, M. (2016) utilized a reference class in their investigation, this one may be a better approach.